Iowa
In anticipation of the upcoming 2011 Iowa State Fair (August 11 to 21), I have compiled “The Color of Crime: Iowa” for OD readers in the Hawkeye State.
As some of you may recall, last year the Iowa State Fair in Des Moines garnered national headlines for “Beat Whitey Night.” Rest assured, DWLs in the media will be hard at work this year trying to bury the truth about race and crime.
In lieu of the upcoming Republican presidential caucuses, the police will be out in force to prevent “Beat Whitey Night” from happening again. It is conceivable that a candidate like Michelle Bachmann could exploit the crime issue to score a big victory in Iowa.
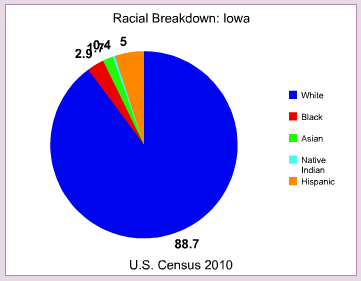
Barack Hussein Obama’s reelection campaign could hinge on a swing state like Iowa. It is thus an electoral imperative for Obama not be associated with the African-Americans who are responsible for 50.2 of robbery in Iowa even though they are only 2.9 percent of the population.
Racial Breakdown: Iowa
Source: U.S. Census 2010
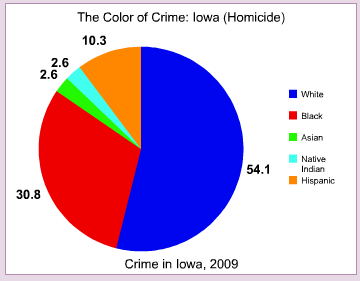
Homicide
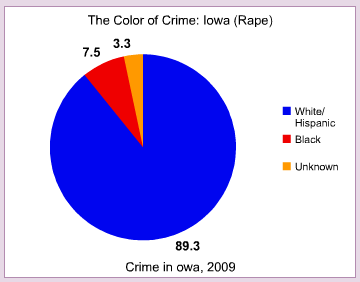
Rape
Robbery
Aggravated Assault
Burglary
Ironically, I keep reading the “Civil Rights Movement” was about “non-violence,” and that Martin Luther King, Jr. in particular was an advocate of “non-violence.” I never hear much talk about “non-violence” from “civil rights leaders” today.
Why is that?
Source: Crime in Iowa, 2009
Note: For some reason, the Iowa crime statistics like to count Hispanics as victims, while counting Hispanic offenders as White. The lone exception is homicide where the Hispanic effect on White violent crime arrests is unmasked.
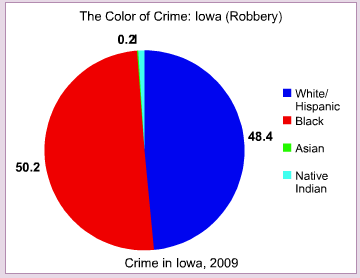
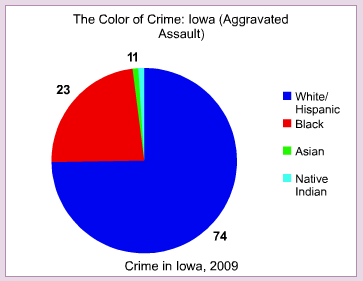

Neat. But the “black” segments of the pie charts should be…in black.
The Iowa crime figures are surely the most telling of any you have done about black criminality.
3% of the population commits 54% of homicides.90% of rapes.
Jesus Christ!.
And,of course,I completely misread the charts.
Sorry,just delete.
White / Hispanic? uhm … no. White and hispanics should be separate. The pie chart comparisons are worthless otherwise.
Typo fix needed.
African-Americans who are responsible for 50.2 of robbery in Iowa
Should be.
African-Americans who are responsible for 50.2% of robbery in Iowa
You can delete this comment after fixing.
In the racial breakdown and poverty pie charts the Hispanics have their own slice but they don’t have their own slice when it comes to crime pie charts. This makes the pie charts very misleading and slanderous. Why is it done like that? This problem must be addressed.